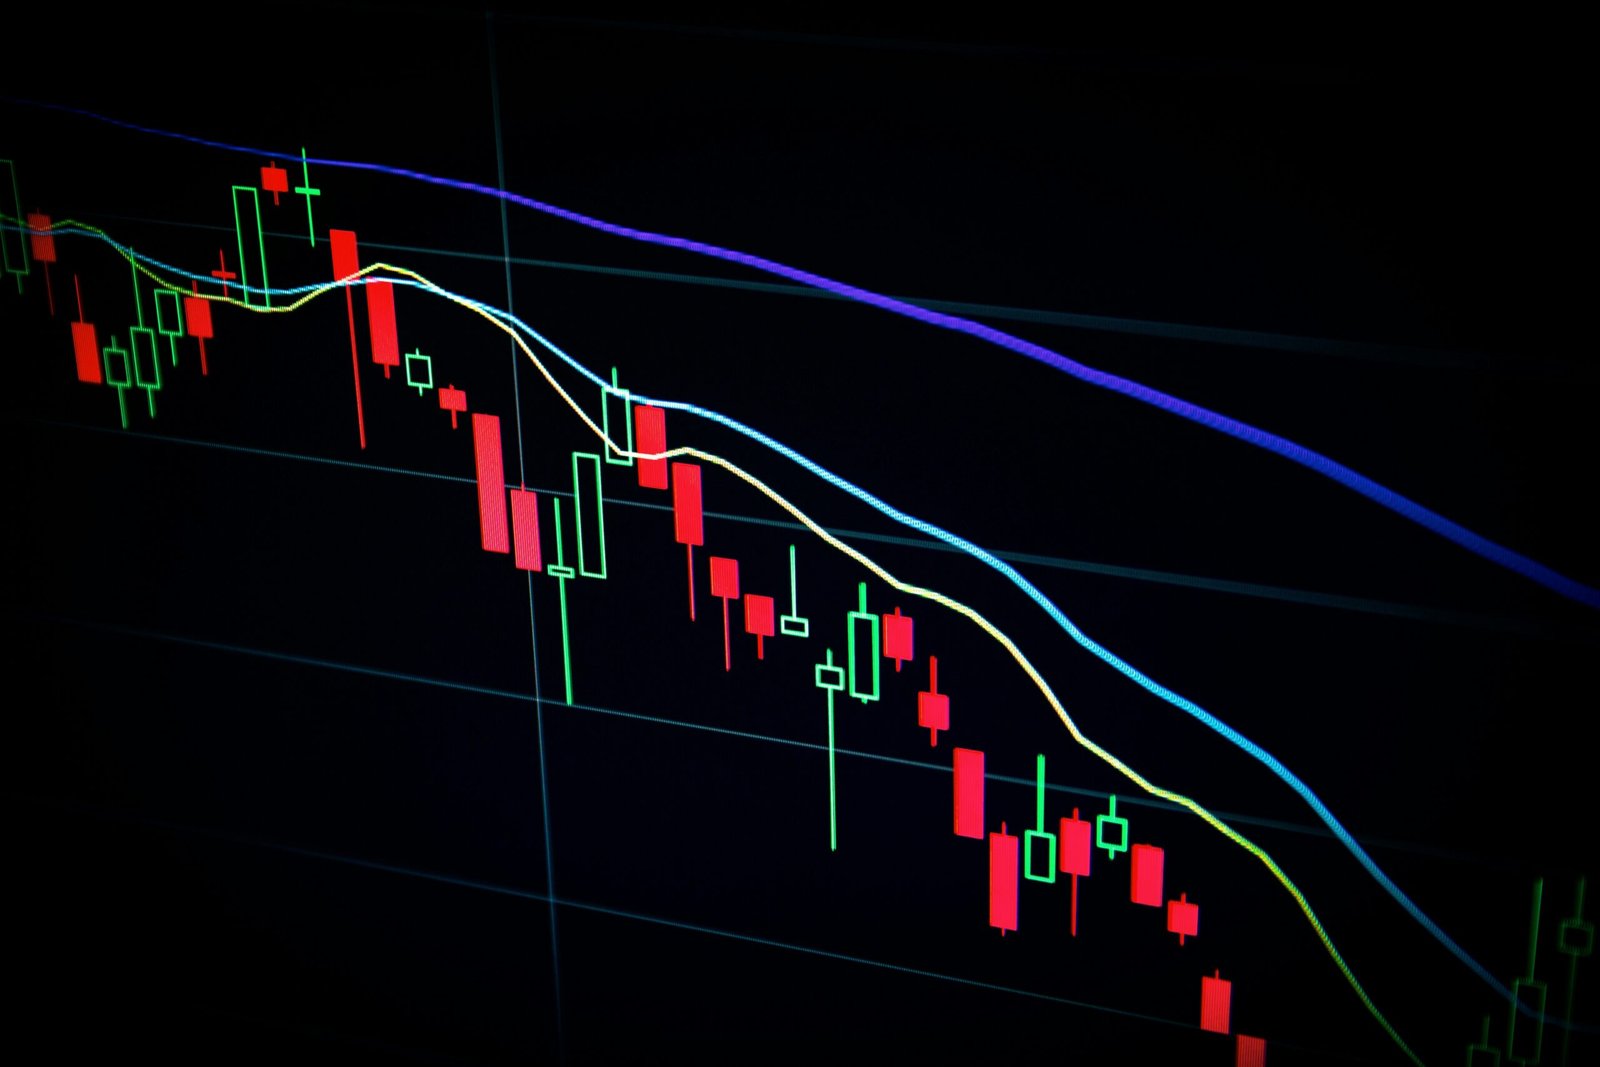
When it comes to stock trading, having a solid understanding of technical analysis indicators is essential for success. These indicators can help traders make informed decisions based on market trends, patterns, and price movements. In this article, we will explore some of the most commonly used technical analysis indicators and how they can be used to improve your trading strategy.
Moving Averages
One of the fundamental technical analysis indicators is the moving average. This indicator smooths out price data to identify trends and potential entry or exit points. Traders often use two types of moving averages: the simple moving average (SMA) and the exponential moving average (EMA).
The SMA calculates the average price over a specific period, while the EMA gives more weight to recent price data. By comparing the current price to the moving average, traders can determine whether the stock is in an uptrend or a downtrend.
Relative Strength Index (RSI)
The Relative Strength Index (RSI) is another popular indicator used to measure the strength and speed of a price movement. It oscillates between 0 and 100, with values above 70 indicating an overbought condition and values below 30 indicating an oversold condition.
Traders use the RSI to identify potential reversal points or confirm the strength of a trend. For example, if a stock is in an uptrend but the RSI is showing overbought conditions, it may indicate a possible trend reversal.
Bollinger Bands
Bollinger Bands are a volatility indicator that consists of a simple moving average and two standard deviation bands. The bands expand and contract based on market volatility, providing traders with a visual representation of price volatility.
When the price touches the upper band, it may indicate an overbought condition, while touching the lower band may indicate an oversold condition. Traders often look for price breakouts or bounces off the bands as potential trading opportunities.
MACD (Moving Average Convergence Divergence)
The Moving Average Convergence Divergence (MACD) is a trend-following momentum indicator that shows the relationship between two moving averages of a stock’s price. It consists of a MACD line, a signal line, and a histogram.
Traders use the MACD to identify potential buy or sell signals. When the MACD line crosses above the signal line, it may indicate a bullish signal, while a cross below the signal line may indicate a bearish signal. The histogram also provides visual confirmation of the strength of the trend.
Stochastic Oscillator
The Stochastic Oscillator is a momentum indicator that compares a stock’s closing price to its price range over a specific period. It oscillates between 0 and 100 and is used to identify overbought and oversold conditions.
Traders look for bullish or bearish divergences between the Stochastic Oscillator and the price to anticipate potential trend reversals. For example, if the stock is making higher highs, but the Stochastic Oscillator is making lower highs, it may indicate a bearish divergence.
Conclusion
Technical analysis indicators play a crucial role in stock trading success. By understanding and effectively using these indicators, traders can make more informed decisions and increase their chances of profitability. Moving averages, RSI, Bollinger Bands, MACD, and Stochastic Oscillator are just a few of the many indicators available to traders.
It is important to note that no single indicator can guarantee success in stock trading. Traders should use a combination of indicators and consider other factors such as fundamental analysis, market conditions, and risk management strategies. Continual learning and practice are key to mastering the art of technical analysis and improving your trading skills.
Remember, the goal of technical analysis is to provide insights and probabilities, not certainties. It is always recommended to combine technical analysis with other forms of analysis and seek professional advice if needed.
